This one of a series of posts on fund performance metrics. Other posts in this series include:
In this post, we will explore internal rate of return (IRR) as a tool for evaluating fund performance metrics.
Recap
In my prior post, we discussed the basics of IRR in a fund context. In this post, we build on that to explore what happens year by year for that fund.
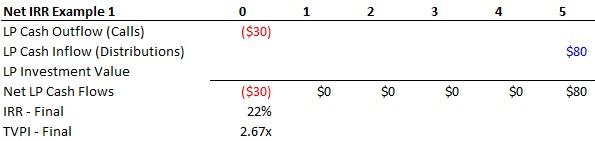
In Example 1 in the last post, we introduced a fund, where the LP paid $30 million to the fund in a capital call at time = 0 and received $80 million back from the fund (as distributions) at the end of year 5. These simple cash flows yielded an IRR of 22% and a TVPI of 2.67x.
- LP Corner: Private Equity Fund Performance – An Overview
- LP Corner: Fund Performance Metrics – Multiples TVPI, DPI and RVPI
- LP Corner: Fund Performance Metrics – Internal Rate of Return (IRR) – Part One
- LP Corner: Fund Performance Metrics – Internal Rate of Return (IRR) – Part Two - This blog post
- LP Corner: Fund Performance Metrics – Public Market Equivalent (PME)
- LP Corner: Fund Performance Metrics - Private Equity Fund Performance
- LP Corner: Gross vs Net Returns
In this post, we will explore internal rate of return (IRR) as a tool for evaluating fund performance metrics.
Recap
In my prior post, we discussed the basics of IRR in a fund context. In this post, we build on that to explore what happens year by year for that fund.
In Example 1 in the last post, we introduced a fund, where the LP paid $30 million to the fund in a capital call at time = 0 and received $80 million back from the fund (as distributions) at the end of year 5. These simple cash flows yielded an IRR of 22% and a TVPI of 2.67x.
To read more, please click on "Read More" to the right below.
Here are some questions. What happened to the fund in years 1 through 4? How did the fund develop? What was the $30 million investment worth at the end of year 1, year 2, etc.? What were the IRRs like along the way? What was TVPI along the way?
Let’s start by exploring what happened at time = 0. The LP has entered into a limited partnership agreement for the fund, and committed to invest $30 million into the fund. The fund made a capital call indicating that the entire $30 million is required by a date certain, which for our model, is time = 0. Note that funds don’t call all committed capital at the beginning of the fund, and so our example isn’t realistic, but this assumption makes the example easier. Therefore, at time = 0, the LP contributed $30 million to the fund. This capital, combined with the capital received from other LPs, is used by the general partner (GP) of the fund to pay for management fee and expenses, and for making investments in portfolio companies.
End of Year 1. Let’s now say that after one year, the fund has paid no distributions to LPs, and our LP receives a statement stating that the LP’s investment is now valued at $27 million. The LP’s investment has lost value, which is expected in the early years of a private equity fund (and most particularly venture capital funds), and is known as the J-Curve. For more on the J-Curve, see the post “LP Corner: The J-Curve.”
Example 1A shows what this looks like in a table:
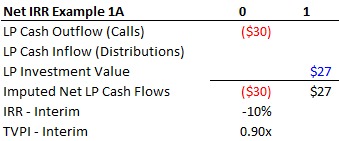
Table 1A above shows that the LP paid out $30 million at time = 0, and at the end of year 1, has received no distributions, but the LP’s investment value is $27 million (this is also known as Residual Value). Since no distributions have been paid, Residual Value is the same as Total Value (Recall Total Value = Distributions + Residual Value).
Now recall that IRR is the return for a series of cash flows – cash flows out and in. The calculation of IRR requires that there be at least one cash outflow and at least one cash inflow. In our example, there is a cash outflow – the $30 million cash outflow for the capital call, but there is no cash inflow – there is no distribution back to the LP. This leads to the critical assumption.
The Critical Assumption. In order to calculate the IRR for Example 1A above, we assume (and this is a big assumption) that the LP’s investment value of $27 million at the end of year 1 is a cash flow back to the LP. This is a critical point – we assume that the LP’s investment value of $27 million is a cash flow back to the LP. This assumption is not reality – in our example, the reality is that the LP doesn’t get any cash back until the end of year 5. This is why the calculated IRR before all cash is returned to the LP is known as “interim IRR.” Interim returns present difficult issues when evaluating the performance of a fund.
Once we assume that the LP’s investment value of $27 million is a cash flow back to the LP, we can calculate the interim IRR, which is -10%. We also make the same assumption to calculate the interim TVPI multiple, which is 0.9x. Note if we calculated IRR or TVPI without making the assumption that the investment value is treated as a cash flow back to the LP, the interim IRR would be -100% and the interim TVPI would be 0.0x. Thus, without making the assumption, the interim return metrics would not provide any useful information.
End of Year 2. At the end of two years, there still have been no distributions to the LP, and the LP receives a statement showing that the LP’s investment value is now $30 million, up from $27 million at the end of year 1. This increase reflects that the fund’s investments have started to improve. The table 1B below shows this:
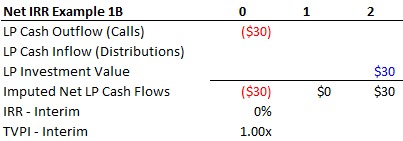
Making the same assumption as before (that the LP investment value is treated as a cash flow back to the LP), provides an interim IRR of 0% and an interim TVPI multiple of 1.00x, reflecting the improvement in the fund’s investments.
End of Year 3. At the end of three years, there still have been no distributions to the LP, and the LP receives a statement showing that the LP’s investment value is now $50 million, significantly up from $30 million one year prior. This is due to the fund’s investments taking off in value. This is shown in Example 1C below:
End of Year 3. At the end of three years, there still have been no distributions to the LP, and the LP receives a statement showing that the LP’s investment value is now $50 million, significantly up from $30 million one year prior. This is due to the fund’s investments taking off in value. This is shown in Example 1C below:
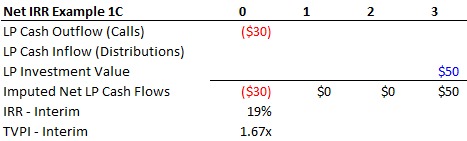
Interim IRR at the end of year 3 is now 19%, up from 0%, and the interim TVPI multiple is 1.67x, up from 1.00x. Nice improvement!
End of Year 4. Same thing, next year. At the end of year 4, there have been no distributions to the LP, and the LP receives a statement showing that the LP’s investment value is now $65 million.
End of Year 4. Same thing, next year. At the end of year 4, there have been no distributions to the LP, and the LP receives a statement showing that the LP’s investment value is now $65 million.
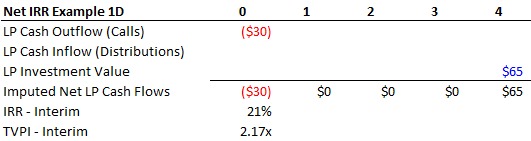
Interim IRR at the end of year 4 is 21% and the interim TVPI multiple is 2.17x.
End of Year 5. At the end of year 5, the fund exits its investments and distributes $80 million to the LP. The fund is liquidated and no longer exists. This is now a final return to the LP.
End of Year 5. At the end of year 5, the fund exits its investments and distributes $80 million to the LP. The fund is liquidated and no longer exists. This is now a final return to the LP.

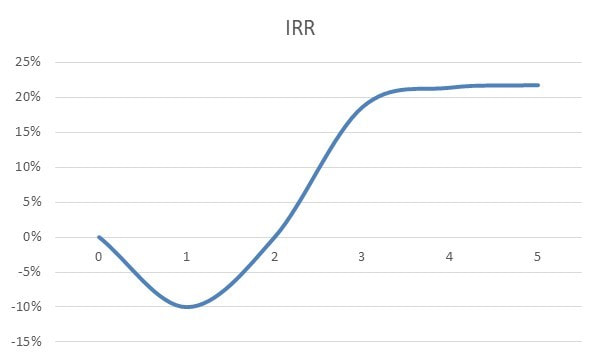
IRR Graph. Now let’s look at how the IRR developed over time graphically. As the graph below demonstrates, the LP experienced the J-Curve, with a negative interim net IRR in year 1, recovering and going positive in later years and leveling off in year 5.
Take-Aways:
Next up: using multiples and IRR to evaluate fund performance against similar funds.
- Gross vs net return. We have examined the cash flows and returns from the perspective of the LP, so these are net returns. Gross returns are the returns a fund obtains from its investments in portfolio companies, which do not deduct management fees, fund expenses, or carried interest. Net returns to the LP do deduct management fees, fund expenses and carried interest. The differential between gross and net returns can be substantial, and LPs ultimately care about net returns.
- Interim vs final return. All returns are interim until the fund has fully liquidated and no longer exists. Once the fund has liquidated, the returns are final. As can be seen from the example, the year 1 interim IRR of -10% is nothing near the final IRR of 22%. However, the year 4 interim IRR of 21% is very close to the final IRR of 22%. Interim returns early in the life of a fund (the first 3-4 years) are not good predictors of final IRRs. However, interim returns late in the life of a fund (years 7 on), especially when there have been meaningful distributions, are better predictors of final fund performance.
- Problems with Interim Returns. The problem with interim returns is that a major assumption has been made – that the LP’s investment value in the fund at the calculation date is a cash flow to the LP. This is a faulty assumption for two main reasons: (1) the LP’s investment value is determined by the GP based on assumptions of value for the fund’s investments, and these estimated values are rarely accurate; and (2) the LP’s investment value is an estimated value for its illiquid stake in the fund – if the stake were to be sold the LP would most likely sell its stake for less than the stated investment value, so the investment value likely overstates the true liquid value for its interest in the fund. The bottom line is that LPs should take interim fund valuations and interim returns with a grain of salt.
Next up: using multiples and IRR to evaluate fund performance against similar funds.
