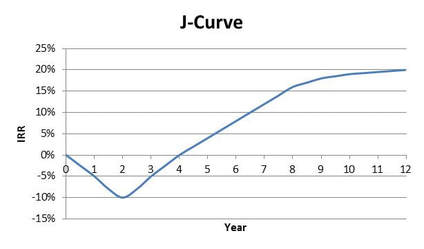
A simplified hypothetical representation is of the J-Curve is below:
Why is this? A few reasons:
- Fund organizational expenses. Funds are expensive to form. Formation expenses include legal, accounting, tax, and travel. These organizational expenses can run from hundreds of thousands of dollars to over a million dollars. It is customary for the fund to reimburse the fund’s general partner (“GP”) for these organizational expenses (up to a negotiated cap). These expenses are paid from the initial capital call.
- Management fees. The fund will pay the GP a management fee, which is usually 2% of committed capital each year during the investing phase of the fund’s life (the first 5 years). This management fee is paid in quarterly installments, in advance. So, for example, if a $100 million fund pays an annual 2% management fee, that equates to $2 million per year, or $500,000 per quarter, paid in advance.
- Fund expenses. The fund also has annual expenses that it pays, including insurance, accounting fees, legal fees, back office fees, brokerage, etc. These expenses aren’t usually very significant but they have a greater impact early in the fund’s life.
- Portfolio valuation. There’s a saying in private equity, particularly in venture capital, that “lemons ripen early.” This is sometimes expressed as “lemons ripen faster than pearls.” These refer to the fact that poor investments are often recognized by the GP early, while good investments will typically take a longer time to mature. When an investment sours (pun intended), the GP will mark-down or write-off the carrying value of the investment. This results in the early performance of the fund to suffer.
The J-Curve tends to be more pronounced in early-stage venture capital funds, as it is expected that 50% to 60% of the fund’s seed and early-stage investments may not return capital. Growth equity funds have shallower J-Curves as the companies in which they invest typically are established companies, with meaningful revenues and positive (or trending positive) cash flows. Buyout funds also can have shallower J-Curves as their investments typically are larger companies with good cash flows. Secondary funds may also have a shallower J-Curve or no J-Curve at all.
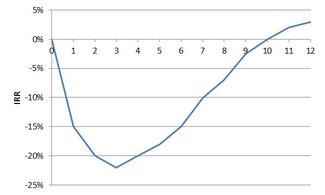
The J-Curve graph shown above is hypothetical. Most funds don’t look like this. Fund returns are highly individual. The return graph for a poor performing fund might look like this:
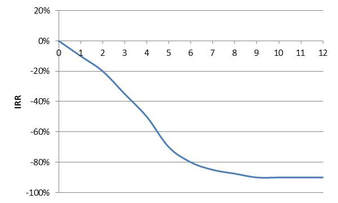
In an extremely bad case, the return graph might look like this:
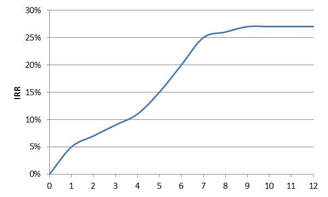
However, some funds may make investments that have a positive event very quickly (a subsequent up financing round, a major milestone achievement, a major customer win, etc.), which leads to a mark-up of the investments. In these cases, the fund may not have a J-Curve at all. The return curve could look like this:
J-Curve and IRRs. Investors in private equity funds often use the Internal Rate of Return (or "IRR") to measure the performance of portfolio funds. Using IRR to measure private equity fund performance has some drawbacks. First, the true IRR of a fund can't be calculated until the fund is finally liquidated - which can be 15-16 years after formation for many funds (and even longer for some funds!). Until a fund is liquidated, an interim IRR is calculated assuming that the fund's latest net asset value (as provided for in the fund's latest quarterly or annual report) is distributed as cash. This assumption has several drawbacks, which will be discussed in an upcoming post. In addition, because of the J-Curve, a fund's interim IRR's tend to be negative in the first few years of a fund's life. Interim IRRs become more meaningful over time and as distributions are paid out to investors.
© 2017 Allen J. Latta. All rights reserved.


