This one of a series of posts on fund performance metrics. Other posts in this series include:
In this post and the next post, we will explore measuring fund performance using internal rate of return or IRR. This post will provide an overview of IRR. If you already have a good grasp of IRR, you can move to part two of this series: LP Corner: Fund Performance Metrics - Internal Rate of Return (IRR) - Part Two.
IRR Overview
In a basic sense, IRR is the return from a series of cash flows over time. In the Private Equity space, IRR is commonly used to evaluate the performance of private equity (including venture capital, growth equity and buyout) funds. IRR is best calculated using Excel, Google Sheets or another financial spreadsheet program.
Simple IRR Examples
Let’s assume that an LP commits $30 million to a fund, and that the fund returns $80 million in distributions to the LP. (For a discussion on committed capital, see "LP Corner: On Committed Capital, Called Capital and Uncalled Capital.") On a multiple basis, this equates to a Total Value to Paid-in-Capital (TVPI) of 2.67x ($80M / $30M) – which sounds pretty good. But let’s explore a bit deeper.
Note that in these examples, we are looking at cash flows from the perspective of an LP - payments made by the LP and money received by the LP. This is known as a "Net IRR" because it focuses on the cash flows to and from the LP. For a discussion of gross vs net returns, see "LP corner: Private Equity Fund Performance - An Overview."
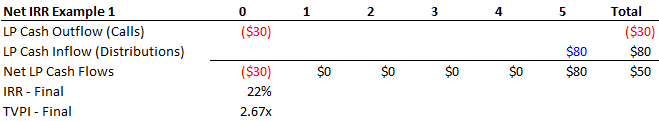
Example 1: Assume that when the fund has its closing (which is time 0 for purposes of calculating the IRR in Excel), it calls all capital from the LP (in reality, this doesn’t happen, but humor me as this is an example). In five years, the fund distributes $80 to the LP. This looks like this:
- LP Corner: Private Equity Fund Performance – An Overview
- LP Corner: Fund Performance Metrics – Multiples TVPI, DPI and RVPI
- LP Corner: Fund Performance Metrics – Internal Rate of Return (IRR) – Part One - This blog post.
- LP Corner: Fund Performance Metrics – Internal Rate of Return (IRR) – Part Two
- LP Corner: Fund Performance Metrics – Public Market Equivalent (PME)
- LP Corner: Fund Performance Metrics - Private Equity Fund Performance
- LP Corner: Gross vs Net Returns
In this post and the next post, we will explore measuring fund performance using internal rate of return or IRR. This post will provide an overview of IRR. If you already have a good grasp of IRR, you can move to part two of this series: LP Corner: Fund Performance Metrics - Internal Rate of Return (IRR) - Part Two.
IRR Overview
In a basic sense, IRR is the return from a series of cash flows over time. In the Private Equity space, IRR is commonly used to evaluate the performance of private equity (including venture capital, growth equity and buyout) funds. IRR is best calculated using Excel, Google Sheets or another financial spreadsheet program.
Simple IRR Examples
Let’s assume that an LP commits $30 million to a fund, and that the fund returns $80 million in distributions to the LP. (For a discussion on committed capital, see "LP Corner: On Committed Capital, Called Capital and Uncalled Capital.") On a multiple basis, this equates to a Total Value to Paid-in-Capital (TVPI) of 2.67x ($80M / $30M) – which sounds pretty good. But let’s explore a bit deeper.
Note that in these examples, we are looking at cash flows from the perspective of an LP - payments made by the LP and money received by the LP. This is known as a "Net IRR" because it focuses on the cash flows to and from the LP. For a discussion of gross vs net returns, see "LP corner: Private Equity Fund Performance - An Overview."
Example 1: Assume that when the fund has its closing (which is time 0 for purposes of calculating the IRR in Excel), it calls all capital from the LP (in reality, this doesn’t happen, but humor me as this is an example). In five years, the fund distributes $80 to the LP. This looks like this:
To read more, please click on "Read More" to the right below.
In the above table for Example 1, the LP call is a negative number (in red) as it represents a cash outflow from the LP (the LP is paying $30 million to the fund). The cash distribution received by the LP is a positive number (in blue) as it represents a cash inflow to the LP (the LP receives $80 million from the fund). So here the LP has $30 million go out the door (cash outflow) at the fund’s closing (time = 0) and receives $80 million in distributions (cash inflow) from the fund at the end of year 5. The TVPI is 2.67x ($80 million divided by $30 million). The calculated IRR for this investment is 22%. (Again, remember that this is a net return, as it represents the return to the LP). A 22% annualized return is pretty darn good.
Let’s look at a variation of the above example:
Let’s look at a variation of the above example:
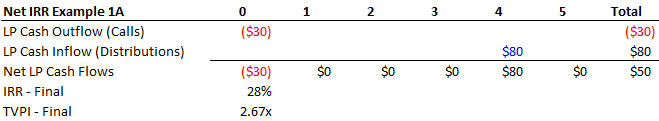
Everything in Example 1A is the same as in Example 1, except that the distribution is received by the LP at the end of year 4 instead of at the end of year 5. The TVPI is the same, but the IRR improves by 6%. The IRR goes to a 28% IRR from a 22% IRR. So a seemingly small change to the timing of distributions can have a large change in the IRR. This highlights the importance of the timing of the cash flows. Getting money back sooner is better than later!
Now let’s look at an example when the calls are made over time and the distributions are received over time.
Now let’s look at an example when the calls are made over time and the distributions are received over time.
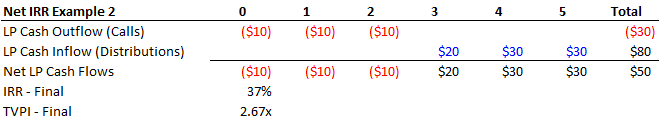
As Example 2 above shows, this fund called $10 million at the closing, and then another $10 million after one year and another $10 million after 2 years, for total called capital of $30 million. At the end of year 3, the LP receives $20 million from the fund as a distribution, receives $30 million in distributions at the end of year 4 and another $30 million at the end of year 5, for total distributions of $80 million. This case is the same as the prior case, except the calls and distributions are made over time. The LP contributes a total amount of $30 million and receives back a total of $80 million, or a 2.67x TVPI. This is the same as in the prior examples. However, in this case, the IRR has increased by 15% to an impressive 38%! This is why multiples (TVPI, DPI and RVPI) don’t on their own tell a complete story, because multiples don’t take into account the time value of money.
Now let’s look at another example.
Now let’s look at another example.
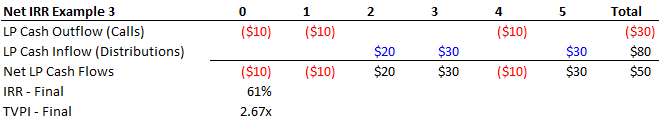
In Example 3 above, the same amount of capital is being contributed by the LP ($30 million over time), and the LP receives the same amount of distributions ($80 million, over time). The TVPI multiple is the same as the cases above – 2.67x. The difference here is that in years 2 and 3 the LP receives distributions, but has another capital call in year 4, followed by a distribution in year 5. Because the timing of the cash flows is different (here the LP is getting distributions earlier and pays its final call later), the IRR is different, and in this case is an amazing 61%.
Observations and Take-Aways
A few observations and take-aways:
In the next post, we will look at more detailed cash flows from a fund.
Observations and Take-Aways
A few observations and take-aways:
- Calls are made over time when needed. In Example 1, the fund called all the capital at closing (time = 0), and the LP received all distributions at the end of year 5. This isn’t realistic, but illustrates why funds call capital over time. They don’t need it all at once – they need it when they make investments or for fees, carried interest and fund expenses. It is better for the fund to only call capital when it is needed, because that improves the IRR for the fund. Having too much cash on a fund’s balance sheet hurts returns (this is known as "cash drag").
- Distributions are paid when possible. Similarly, returning capital sooner to LPs increases the IRR. This incentivizes the general partner of the fund to return as much capital as it can, reserving some for fund expenses and any imminent investment. The combination of calling capital over time when needed, and returning capital as soon as possible can have a significant impact on the fund’s IRR (but won’t have any impact on the multiple).
- Multiples don’t take into account the time value of money. The major weakness of multiples is they don’t take into account the time value of money. IRR directly addresses this. Notice in every example the cash on cash return stays the same.
- Fund cash flows vary. When a fund makes its initial capital call, the IRR clock starts. When the fund makes the last distribution to the LPs, the IRR clock stops. What happens in between is a series of calls and distributions that make up the cash flows of a fund.
In the next post, we will look at more detailed cash flows from a fund.
