This one of a series of posts on fund performance metrics. Other posts in this series include:
We have now discussed two of the three primary metrics uses to evaluate the performance of private equity funds: (1) the multiples TVPI, DPI and RVPI; and (2) IRR. We will now explore the third primary metric: Public Market Equivalent, or PME.
Overview
Broadly speaking, PME is a return metric that compares the return of a private equity fund (or a portfolio of funds) to the hypothetical return of a chosen public stock market index, such as the S&P 500 or Nasdaq, using the cash flows as the fund as a basis for investment in the stock market index. For example, a fund may have an IRR of 15%, while the PME obtained using the S&P 500 as the index is 10%, suggesting that the fund has outperformed the S&P 500 by 500 basis points (bps).
There are several variations of PME, but these are commonly used:
LN PME
The LN PME (also known as the Index Comparison Method or ICM) is widely considered the “first” PME approach (and it is often referred to simply as “PME”). The LN PME matches each contribution and distribution of a fund with a hypothetical purchase and sale of a reference public market index, such as the S&P 500. The residual value of the fund is not matched to the LN PME; rather, the LN PME residual value is based on the performance of the hypothetical invested capital in the index. With these cash flows, an LN PME return for the public market index is compared directly against the IRR for the fund. If the fund’s IRR exceeds the LN PME, then the fund has outperformed the public market index. If the LN PME IRR exceeds the fund’s IRR, then the fund has underperformed the public market index. Note that the IRR generated using LN PME isn’t a “real” IRR – it’s an estimation because of the manipulation of the residual value.
One nice thing about the LN PME is that it is conceptually straightforward. However, the mechanics of LN PME have some issues. One issue for the LN PME approach is that the residual value for the PME index can be negative. This can occur if the fund has distributions early in the life of the fund, or has a series of large distributions late in the life of the fund. The problem is that a fund can’t have a negative residual value (technically a fund could have a negative residual value, but it would be a very rare case). As a result, LN PME isn’t used very often in private equity. The other forms of PME attempt to address the drawbacks of the LN PME.
Let’s look at an example:
First consider the fund that we want to evaluate. The fund is presented below:
- LP Corner: Private Equity Fund Performance – An Overview
- LP Corner: Fund Performance Metrics – Multiples TVPI, DPI and RVPI
- LP Corner: Fund Performance Metrics – Internal Rate of Return (IRR) – Part One
- LP Corner: Fund Performance Metrics – Internal Rate of Return (IRR) – Part Two
- LP Corner: Fund Performance Metrics – Public Market Equivalent (PME) - This blog post.
- LP Corner: Fund Performance Metrics - Private Equity Fund Performance
- LP Corner: Gross vs Net Returns
We have now discussed two of the three primary metrics uses to evaluate the performance of private equity funds: (1) the multiples TVPI, DPI and RVPI; and (2) IRR. We will now explore the third primary metric: Public Market Equivalent, or PME.
Overview
Broadly speaking, PME is a return metric that compares the return of a private equity fund (or a portfolio of funds) to the hypothetical return of a chosen public stock market index, such as the S&P 500 or Nasdaq, using the cash flows as the fund as a basis for investment in the stock market index. For example, a fund may have an IRR of 15%, while the PME obtained using the S&P 500 as the index is 10%, suggesting that the fund has outperformed the S&P 500 by 500 basis points (bps).
There are several variations of PME, but these are commonly used:
- LN PME, developed by Austin Long and Craig Nickels in 1996
- PME+, developed by Capital Dynamics in 2003
- KS PME, developed by Steve Kaplan and Antoinette Schoar in 2005
- mPME, developed by Cambridge Associates and introduced in 2013
- Direct Alpha, developed by Oleg Gredil, Barry Griffiths and Rüdiger Stucke in 2014
LN PME
The LN PME (also known as the Index Comparison Method or ICM) is widely considered the “first” PME approach (and it is often referred to simply as “PME”). The LN PME matches each contribution and distribution of a fund with a hypothetical purchase and sale of a reference public market index, such as the S&P 500. The residual value of the fund is not matched to the LN PME; rather, the LN PME residual value is based on the performance of the hypothetical invested capital in the index. With these cash flows, an LN PME return for the public market index is compared directly against the IRR for the fund. If the fund’s IRR exceeds the LN PME, then the fund has outperformed the public market index. If the LN PME IRR exceeds the fund’s IRR, then the fund has underperformed the public market index. Note that the IRR generated using LN PME isn’t a “real” IRR – it’s an estimation because of the manipulation of the residual value.
One nice thing about the LN PME is that it is conceptually straightforward. However, the mechanics of LN PME have some issues. One issue for the LN PME approach is that the residual value for the PME index can be negative. This can occur if the fund has distributions early in the life of the fund, or has a series of large distributions late in the life of the fund. The problem is that a fund can’t have a negative residual value (technically a fund could have a negative residual value, but it would be a very rare case). As a result, LN PME isn’t used very often in private equity. The other forms of PME attempt to address the drawbacks of the LN PME.
Let’s look at an example:
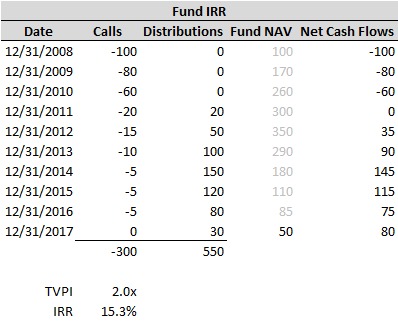
First consider the fund that we want to evaluate. The fund is presented below:
To read more, please click on "Read More" to the right below.
The fund has a TVPI of 2.0x and a 15.3% IRR. Recall capital calls are presented as negative numbers to show they are a cash outflow for the LPs. Distributions are positive as they are cash inflows to the LP. The fund NAV is shaded for each year other than the final evaluation year, as we are focusing on the residual value remaining in the fund at 12/31/2017.
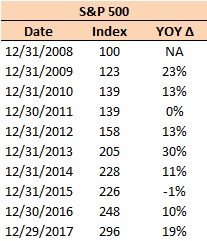
Now consider the S&P 500 over this period of time. The S&P closing prices are indexed, with the initial value equal to 100.
Now consider the S&P 500 over this period of time. The S&P closing prices are indexed, with the initial value equal to 100.
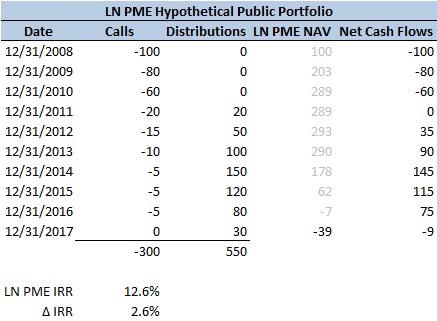
Here are the LN PME calculations:
I have uploaded the spreadsheet as a Google Doc. The link is:
https://docs.google.com/spreadsheets/d/1Dj1cKYU5ic9_BeKr9op226zfQWVPGTfKI49fgx0dfKE/edit?usp=sharing. Please let me know if you find any errors, or a better way to do any of the calculations.
As the above table shows, the LN PME arrives at a negative number for the residual value of the fund. Note that the interim NAVs are shaded as they are not used for the cash flow calculation. Only the calls, distributions and the residual value are used for the cash flow (and IRR) calculation. On a comparison basis, the LN PME IRR is 12.6% compared to the fund’s IRR of 15.3%, suggesting that the fund outperformed the S&P 500 by 2.6%.
PME+
PME+, also known as Capital Dynamics PME+, attempts to address the issue with LN PME by obtaining a residual value for the PME+ index that is equal to the fund’s residual value. To do this, a scaling factor is applied to the fund’s distributions. PME+ generates a PME+ IRR for the index, which can be compared directly to the fund’s IRR. As before, if the fund’s IRR exceeds the PME+ IRR, the fund has outperformed the index. If the PME+ IRR exceeds the fund’s IRR, the fund has under-performed compared to the index. But as before, due to the scaling factor, this approach is also heuristic in nature.
Let’s calculate PME+ for our example:
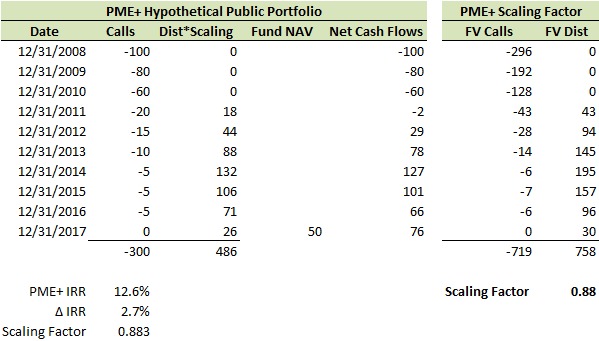
The first step for the PME+ calculations is to calculate the scaling factor. Once this scaling factor is computed, then it is applied to the distributions to obtain the scaled distributions. The IRR for the PME+ Index is then calculated. Here the PME+ IRR is 12.6%, compared to the fund’s IRR of 15.3%, suggesting that the fund outperformed the S&P 500 by 2.7%.
KS PME
KS PME takes a different approach to compare a fund’ performance to that of an index. In effect, the fund’s individual calls and distributions are revalued to their future value at the time of the evaluation. The nice thing about this is that the fund’s residual value stays the same, as it is already expressed in the future value. These values are then totaled to provide a future value for all of the calls, and a future value for all of the distributions plus the residual value. These figures are used to calculate the KS PME metric.
The KS PME provides a multiple, such as 1.7. If the KS MPE multiple exceeds 1.0, then the fund has outperformed the index. If the KS MPE multiple is less than 1.0, then the fund has under-performed the index.
One issue with the KS PME is that it does not take into account the timing of the cash flows. However, it does provide a multiple of outperformance, which is helpful.
Example:
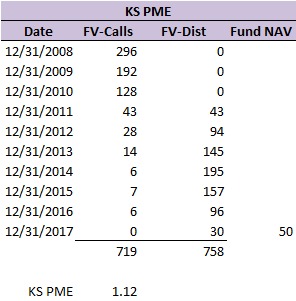
As shown above, the future values of the calls and distributions are calculated, using the index performance for the calculation. Once that is complete, the KS PME is calculated. Here, the KS PME is 1.12, which indicates that the fund has outperformed the S&P 500. However, the KS PME does not provide a percentage return, so one cannot compare the KS PME metric directly to the IRR of the fund.
mPME
Cambridge Associates developed the mPME to address some of the issues of the LN PME method. In the mPME method, fund distributions and the interim fund net asset values are scaled proportionately to the changing value of the fund’s net asset values. In this manner, a mPME IRR can be calculated. As before, if the fund’s IRR exceeds the mPME, the fund has outperformed the index. If the mPME IRR exceeds the fund’s IRR, the fund has under-performed compared the index. But as before, due to the changes to distributions and the net asset values, the mPME approach is also heuristic in nature.
Let’s look at the example:
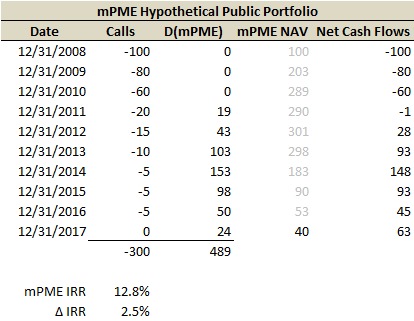
As can be seen from the table above, the mPME IRR is 12.8%, compared to the 15.3% for the fund. This suggests that the fund outperformed the S&P 500 by 2.5%.
Direct Alpha
Direct Alpha was developed in 2014 in an attempt to address limitations of other PME methodologies. In the Direct Alpha approach, the fund’s calls and distributions are converted to their future values as of the evaluation date, using the index as the basis for the calculation. An IRR is calculated based on these future values for the calls and distributions and the residual value. The residual value isn’t recalculated as it is already at the future value, since it is the value as of the evaluation date. The resulting Direct Alpha value is the excess (or negative) return provided by the fund over the stock market index.
Applying this to the example:
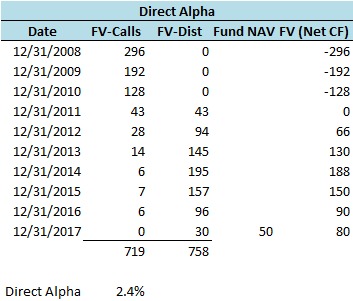
As can be seen from the table above, the fund’s Direct Alpha is 2.4%. As the fund’s IRR was 15.3%, this means the S&P 500 returned 12.9%. The nice thing about Direct Alpha is there's no scaling going on. It's a direct way of measuring alpha.
Observations and notes:
Resources:
I have uploaded the spreadsheet with the examples as a Google Doc. The link is:
https://docs.google.com/spreadsheets/d/1Dj1cKYU5ic9_BeKr9op226zfQWVPGTfKI49fgx0dfKE/edit?usp=sharing
The original paper on PME by Long and Nickels can be found here:
http://alignmentcapital.com/pdfs/research/icm_aimr_benchmark_1996.pdf
The original paper on Direct Alpha can be found here:
https://papers.ssrn.com/sol3/papers.cfm?abstract_id=2403521
This paper also has a good comparison of the different methodologies.
The British Private Equity & Venture Capital Association has published a useful guide “Private Equity Performance Measurement” (2015), which can be found here:
https://www.bvca.co.uk/Portals/0/library/documents/BVCA%20Perspective%20Series/Private%20Equity%20Performance%20Measurement.pdf?ver=2015-04-09-105554-523
Observations and notes:
- In this example, each PME method found that the fund outperformed the S&P 500 index for the referenced period. The outperformance ranged from 2.4% to 2.7%.
- The KS PME and the Direct Alpha methodologies don’t involve any “scaling” to the calls, distributions or residual value, and so provide more direct ways of calculating alpha.
- The LN PME, PME+ and mPME methodologies do involve scaling of one or more of calls, distributions and/or residual value, and as such are estimates of the comparative performance of the fund to the public market index.
- One the PME is calculated and a fund has outperformed, the question is then whether this outperformance is sufficient to offset the risk and illiquid nature of the private equity fund.
Resources:
I have uploaded the spreadsheet with the examples as a Google Doc. The link is:
https://docs.google.com/spreadsheets/d/1Dj1cKYU5ic9_BeKr9op226zfQWVPGTfKI49fgx0dfKE/edit?usp=sharing
The original paper on PME by Long and Nickels can be found here:
http://alignmentcapital.com/pdfs/research/icm_aimr_benchmark_1996.pdf
The original paper on Direct Alpha can be found here:
https://papers.ssrn.com/sol3/papers.cfm?abstract_id=2403521
This paper also has a good comparison of the different methodologies.
The British Private Equity & Venture Capital Association has published a useful guide “Private Equity Performance Measurement” (2015), which can be found here:
https://www.bvca.co.uk/Portals/0/library/documents/BVCA%20Perspective%20Series/Private%20Equity%20Performance%20Measurement.pdf?ver=2015-04-09-105554-523
