This one of a series of posts on fund performance metrics. Other posts in this series include:
We have now discussed the three metrics that are primarily used to evaluate the performance of private equity funds: (1) the multiples TVPI, DPI and RVPI; (2) IRR; and (3) PME. We will now discuss how to use these metrics to evaluate the performance of private equity funds.
Overview
There are several ways to evaluate the performance of a fund, or a portfolio of funds, with the main methods being:
Absolute Return
Absolute return refers to a specific threshold requirement for a fund’s performance. For example, some LPs may say that they expect a 3.0x TVPI and 30% IRR net return from early stage venture capital funds, or a 2.0x and 20% return for buyout funds. If a fund’s return exceeds these metrics, then it “outperforms” the metrics. If a fund’s returns are less than these metrics, then the fund “underperforms.”
A note about absolute return. Most funds experience a J-Curve, where performance declines in the first couple of years of a fund when fund expenses and investment losses exceed investment gains, but the fund’s performance improves over the next several years. The J-Curve is more pronounced for early-stage venture capital funds. The J-Curve looks something like this:
- LP Corner: Private Equity Fund Performance – An Overview
- LP Corner: Fund Performance Metrics – Multiples TVPI, DPI and RVPI
- LP Corner: Fund Performance Metrics – Internal Rate of Return (IRR) – Part One
- LP Corner: Fund Performance Metrics – Internal Rate of Return (IRR) – Part Two
- LP Corner: Fund Performance Metrics – Public Market Equivalent (PME)
- LP Corner: Fund Performance Metrics - Private Equity Fund Performance - This blog post.
- LP Corner: Gross vs Net Returns
We have now discussed the three metrics that are primarily used to evaluate the performance of private equity funds: (1) the multiples TVPI, DPI and RVPI; (2) IRR; and (3) PME. We will now discuss how to use these metrics to evaluate the performance of private equity funds.
Overview
There are several ways to evaluate the performance of a fund, or a portfolio of funds, with the main methods being:
- Absolute return.
- Comparative return to other similar funds (Quartile Analysis).
- Comparative return to the public markets (PME Analysis).
Absolute Return
Absolute return refers to a specific threshold requirement for a fund’s performance. For example, some LPs may say that they expect a 3.0x TVPI and 30% IRR net return from early stage venture capital funds, or a 2.0x and 20% return for buyout funds. If a fund’s return exceeds these metrics, then it “outperforms” the metrics. If a fund’s returns are less than these metrics, then the fund “underperforms.”
A note about absolute return. Most funds experience a J-Curve, where performance declines in the first couple of years of a fund when fund expenses and investment losses exceed investment gains, but the fund’s performance improves over the next several years. The J-Curve is more pronounced for early-stage venture capital funds. The J-Curve looks something like this:
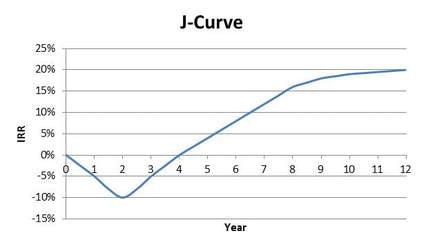
For more on the J-Curve, see my post: “LP Corner: The J-Curve.”
The point here is that using absolute returns are really only useful late in a fund’s life or after the fund is liquidated. If one were to apply a 20% absolute return metric to the fund in the J-Curve example above, the fund would underperform all years until the last year in the graph.
To read more, please click "Read More" to the right below.
Example:
For this discussion, we will use the following two buyout funds for comparison purposes:
For this discussion, we will use the following two buyout funds for comparison purposes:

Using an absolute return for buyouts of 2x TVPI and 20% return, let’s examine the funds. Buyout Fund 1 is in its eight year, and so mature enough that the metrics are meaningful. Buyout Fund 1 has a 26.7% IRR (note this is an interim IRR), so it handily beats the 20% IRR target. It also has a 2.3x TVPI, which beats the 2x TVPI metric. To me, DPI is a critical metric – the higher DPI is as a percentage of the TVPI, the better. Recall that DPI is cash that’s been paid out to the LPs. Also recall that TVPI = DPI + RVPI. RVPI (Residual Value to Paid-in-Capital) is what I call a “squishy” metric. Residual value is value remaining in the fund and the portfolio company investments. Residual value is a moving target. It should go up, but as a portfolio company ages, it might not perform as expected and so may sell for less than the value the fund is reporting. Here, Buyout Fund 1 has a 1.6x DPI, which means that almost 70% of the fund’s current value (1.6 / 2.3 = 70%) has been paid to the LPs as distributions. This seems good to me. All in all, Buyout Fund 1 is a very well-performing fund.
Buyout Fund 2 on the other hand, is a different story. It is in its seventh year (a year younger than Fund 1), and so its investment portfolio is less developed, and one might expect it is still climbing the J curve. Buyout Fund 2’s IRR is 14.6%, well below the 20% return target, and its TVPI of 1.6 is below the 2.0x target. More troubling to me is the low DPI of 0.3x – this means that only 30% of paid-in-capital has been returned to the LPs. It also means that RVPI is 1.3x, so a whopping 82% of the TVPI is in residual value. This does not bode well for Buyout Fund 2. Although Buyout Fund 2 still has time to mature, at this stage the returns are disappointing.
Comparative return to other similar funds (Quartile Analysis)
Comparing a fund’s return to other similar funds is a very common way to evaluate the performance of a fund. A common refrain among GPs is that their fund is “top quartile” or “top decile.” What this means is that their fund has outperformed at least 75% (in the case of “top quartile”) or at least 90% (in the case of top decile) of funds of the same vintage year pursuing a similar strategy.
In order to conduct a comparative return analysis, statistics for comparable funds must be obtained. There are a number of sources for these statistics, but most require a subscription. Cambridge Associates, a leading private equity consulting company, produces quarterly benchmarks and statistics that they make available on their website, which can be found here:
https://www.cambridgeassociates.com/benchmarks/. Cambridge Associates publishes reports for US venture capital, US private equity, global buyout and growth equity, and more. Find the report that applies to the fund’s strategy, and then look for the metrics you want to evaluate.
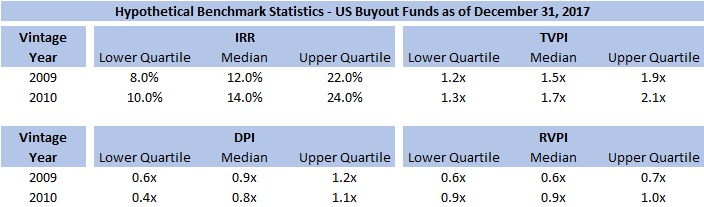
For example, the chart below provides hypothetical benchmark statistics for US buyout funds as of December 31, 2017.
Buyout Fund 2 on the other hand, is a different story. It is in its seventh year (a year younger than Fund 1), and so its investment portfolio is less developed, and one might expect it is still climbing the J curve. Buyout Fund 2’s IRR is 14.6%, well below the 20% return target, and its TVPI of 1.6 is below the 2.0x target. More troubling to me is the low DPI of 0.3x – this means that only 30% of paid-in-capital has been returned to the LPs. It also means that RVPI is 1.3x, so a whopping 82% of the TVPI is in residual value. This does not bode well for Buyout Fund 2. Although Buyout Fund 2 still has time to mature, at this stage the returns are disappointing.
Comparative return to other similar funds (Quartile Analysis)
Comparing a fund’s return to other similar funds is a very common way to evaluate the performance of a fund. A common refrain among GPs is that their fund is “top quartile” or “top decile.” What this means is that their fund has outperformed at least 75% (in the case of “top quartile”) or at least 90% (in the case of top decile) of funds of the same vintage year pursuing a similar strategy.
In order to conduct a comparative return analysis, statistics for comparable funds must be obtained. There are a number of sources for these statistics, but most require a subscription. Cambridge Associates, a leading private equity consulting company, produces quarterly benchmarks and statistics that they make available on their website, which can be found here:
https://www.cambridgeassociates.com/benchmarks/. Cambridge Associates publishes reports for US venture capital, US private equity, global buyout and growth equity, and more. Find the report that applies to the fund’s strategy, and then look for the metrics you want to evaluate.
For example, the chart below provides hypothetical benchmark statistics for US buyout funds as of December 31, 2017.

With this information, the performance of a fund can be compared to other funds of its vintage, using IRR, TVPI and DPI.
A note on quartiles. “Upper quartile” means funds beating the metric are in the top 25% of performance. Another way of looking at this is that an upper quartile performer has outperformed better than 75% of funds of this vintage. Performing in the upper quartile is a very good thing. (Cambridge Associates also privately produces a metric of top decile, meaning the funds with top 10% performance.) A fund with performance between the median and upper quartile (called the “second quartile”) means it has performed better than at least half of the funds of this vintage, but has performed more poorly than at least 25% of funds in its vintage. A fund performing below the lower quartile (called the “bottom quartile”) return has performed dismally – and the chances that this manager raises a subsequent fund are low. A fund performing between the lower quartile and the median (called the “third quartile”), means it is in the lower half of funds, but at least better than the bottom 25% of funds. This is shown in the table below.
A note on quartiles. “Upper quartile” means funds beating the metric are in the top 25% of performance. Another way of looking at this is that an upper quartile performer has outperformed better than 75% of funds of this vintage. Performing in the upper quartile is a very good thing. (Cambridge Associates also privately produces a metric of top decile, meaning the funds with top 10% performance.) A fund with performance between the median and upper quartile (called the “second quartile”) means it has performed better than at least half of the funds of this vintage, but has performed more poorly than at least 25% of funds in its vintage. A fund performing below the lower quartile (called the “bottom quartile”) return has performed dismally – and the chances that this manager raises a subsequent fund are low. A fund performing between the lower quartile and the median (called the “third quartile”), means it is in the lower half of funds, but at least better than the bottom 25% of funds. This is shown in the table below.

Using the hypothetical statistics, if a 2009 vintage fund has an IRR of 25%, it beats the upper quartile metric of 22% and has earned the right to call itself a “top quartile” fund. If a 2010 vintage fund has an IRR of 12%, it is a third quartile performer (better return than the lower quartile 10% but below the median of 14%).
Reporting Lag. Note that funds report financial information to LPs months after the end of the reporting period. For example, funds usually don’t report quarterly returns until 45 days after the end of the quarter, and don’t report annual returns until 60 days after the end of the year (international funds may have a longer time period). As a result, industry benchmark reports lag by several months. Make sure the reporting periods are the same for the fund and the industry benchmark report you use.
Example
With this information the fund, let’s see how our buyout funds are doing.

Buyout Fund 1 is a 2009 vintage fund and has a 26.7% IRR, which handily beats the upper quartile return of 22.0%, and so the fund is in the “top quartile” for IRR. It has a TVPI of 2.3x, which is also top quartile. Its DPI of 1.6x is also top quartile. Finally, its RVPI is 0.7x, which puts it in the third quartile. But I consider this RVPI metric a good thing for this fund. Recall that TVPI = DPI and RVPI. If TVPI is high and DPI is high, then RVPI must be low. We want TVPI to be high and DPI to be high, and so a low RVPI in this case is a good thing. So, all in all, Buyout Fund 1 is a solid “top quartile” performer.
Buyout Fund 2 is a 2010 vintage fund and has 13.6% IRR, which puts it in the third quartile (its performance is below the median IRR of 14.0% but higher than the lower quartile return of 10.0%). This means that it is underperforming over half of the funds in its vintage. Buyout Fund 1 also has a TVPI of 1.6x, just below the 1.7x median TVPI for 2010 funds. This means it is a third quartile performer for TVPI. DPI is 0.3x, which is below the lower quartile metric of 0.4x, which means the fund has returned very little cash to LPs compared to other funds of the 2010 vintage. Finally, RVPI is 1.3x, which puts it in the “upper quartile” for RVPI – but this is a BAD thing. Recall TVPI = DPI + RVPI. We want high TVPI, high DPI and low RVPI. The higher the RVPI, the more value remains in the portfolio. In the early years of a fund’s life, that’s expected, but in year 7 of a buyout fund’s life, we want to see a higher DPI and a lower RVPI. The bottom line here is that Buyout Fund 2 is a poor performer at this point. If the fund’s remaining portfolio companies do very well in the future, it could achieve better performance, but to me it seems unlikely.
Comparative return to the public markets (PME Analysis).
The final piece of the performance pie is PME analysis. Once the PME is calculated (by whatever method), the PME for the specified index can be compared against the fund’s performance. See my prior post on how to calculate PME:
http://www.allenlatta.com/allens-blog/lp-corner-fund-performance-metrics-public-market-equivalent-pme
Most LPs I speak to expect their buyout funds (and entire private equity programs) to exceed a selected public market benchmark (S&P 500, Russell 2000, Russell 3000 or Nasdaq are common benchmarks) by 300 bps to 500 bps (3% to 5%). For venture funds, some LPs expect even greater excess returns to account for the risk, and so expect their venture capital funds to exceed the public market benchmark by 300 bps to 700 bps.
Example

For Buyout Fund 1, let’s assume the calculated PME metric provides an IRR of 21%. As Buyout Fund 1 has an IRR of 26.7%, this suggests outperformance by the fund of 5.7% (570 bps). If the LP’s return target is 300 bps to 500 bps outperformance over the public market index, then Buyout Fund 1 has exceeded this target.
For Buyout Fund 2, let’s assume the calculated PME metric provides an IRR of 16%. As Buyout Fund 2 has an IRR of 13.6%, this fund has underperformed the public market index by 240 bps (2.4%). This is poor performance.
Final Notes and Observations
- Make sure to compare apples to apples. When using industry metrics, such as the Cambridge Associates benchmark statistics, make sure to use the right report (venture capital, buyout, etc.) to match the strategy of the fund. Also make sure to use performance metrics for the fund as of the same date as the industry statistics. Using a different date, even if its only off by a quarter, can materially impact the analysis.
- Evaluating a fund’s performance early in its life is difficult. During the first 3-5 years of a fund’s life, evaluating performance using standard metrics (IRR, multiples, PME) is hard. This is because of the J-Curve. In my experience, it isn’t until around years 7 to 8 that a fund has really matured to a point that the performance can be useful. Before that time, comparative metrics (quartile analysis) can help somewhat, but a close examination of the performance of the underlying portfolio is required.
- No one metric tells the whole story. This post has discussed IRRs and multiples. Prior posts have discussed the problems with using interim IRRs. Multiples themselves don't take into account time. To evaluate performance, LPs must use a variety of metrics.
- Cash (in the form of DPI) is king! To me, DPI is a very important and useful performance measure. DPI indicates what proportion of the paid-in-capital has been returned to the LPs. This is the cash-on-cash return. Cash is king – at the end of the fund’s life DPI will equal TVPI, as all of the fund’s investments will have been liquidated and distributed to the LPs. Earlier in a fund’s life, DPI indicates how much cash has been returned to the LPs. I want to see top-quartile TVPI and top-quartile DPI. If DPI is low, it means most of the TVPI value is in residual value, and residual value is squishy!
- RVPI is squishy. Residual value is the estimated value of the fund and its remaining investments. The value of the fund’s investments is made each quarter by the GP, and valuation is subjective. There’s a lot of leeway for a GP to assign a value to an investment. For example, consider two funds that invest in the same financing, and a year later one GP is bullish on the company and the other GP is bearish on the company. The bullish GP might assign a value to the company that is greater than the value assigned by the bearish GP. I see this regularly. RVPI is expected to be high early in a fund’s life, but is expected to decline as distributions are paid to LPs and the portfolio matures later in the fund’s life.
- A note on industry statistics. I take reported multiples with a grain of salt. The providers of industry statistics rely on self-reporting from funds. Not all funds participate in providing information. While there are hundreds of private equity funds raised each year, the industry statistics are based on a subset of the funds, usually between 35 and 90 funds. As a result, while the industry statistics are a good guide, they are not gospel.
- Reporting lag. As discussed above, it can take a long time for industry reports to be published, and so the reporting lags by a quarter or two. This means the performance evaluation is based on performance that is a quarter or two old. A lot can happen in a quarter or two!
Request to the reader: Please help me improve this post. Please contact me with any suggestions on how to make this better, clarifications and typos. Thanks!
© 2018 Allen J. Latta. All rights reserved.
