,This one of a series of posts on fund performance metrics. Other posts in this series include:
We have discussed how to evaluate fund performance, but a common area of confusion is gross returns versus net returns. I briefly introduced this topic in LP Corner: Private Equity Fund Performance - An Overview, and this post expands on that introduction.
When talking returns in private equity, it is very important to know what kind of returns you are discussing: gross or net returns. The difference between these two metrics can be meaningful, and so it is important to know what is being discussed. Gross returns, simply stated, are the returns a fund obtains from its investments, without deducting any management fees, fund expenses or carried interest. Net returns are the returns a limited partner (LP) receives from the fund, after deduction of all management fees, fund expenses and carried interest. LPs are about net returns, as net returns are the real returns an LP receives from its investment in a fund.
When we talk about gross vs net returns, it can apply to gross vs net IRRs or gross vs net TVPI multiple.
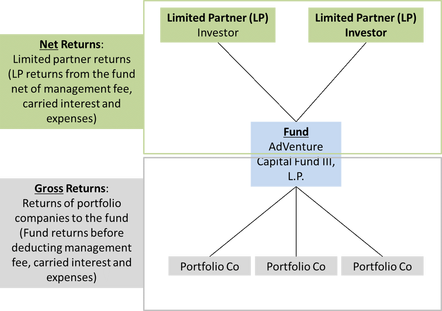
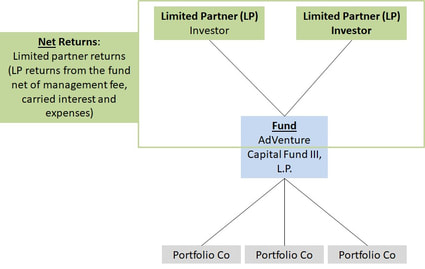
The graphic below shows the difference between gross and net returns for a fund. LPs invest in a fund. The fund invests in portfolio companies. Gross Returns are the returns the fund obtains from its investments in portfolio companies. Gross Returns are before deducting management fee, fund expenses and carried interest. Once the fund does deduct the management fee, fund expenses and carried interest, the return the LPs obtain from the fund are the Net Returns.
- LP Corner: Private Equity Fund Performance – An Overview
- LP Corner: Fund Performance Metrics – Multiples TVPI, DPI and RVPI
- LP Corner: Fund Performance Metrics – Internal Rate of Return (IRR) – Part One
- LP Corner: Fund Performance Metrics – Internal Rate of Return (IRR) – Part Two
- LP Corner: Fund Performance Metrics – Public Market Equivalent (PME)
- LP Corner: Fund Performance Metrics - Private Equity Fund Performance
- LP Corner: Gross vs Net Returns - this blog post
We have discussed how to evaluate fund performance, but a common area of confusion is gross returns versus net returns. I briefly introduced this topic in LP Corner: Private Equity Fund Performance - An Overview, and this post expands on that introduction.
When talking returns in private equity, it is very important to know what kind of returns you are discussing: gross or net returns. The difference between these two metrics can be meaningful, and so it is important to know what is being discussed. Gross returns, simply stated, are the returns a fund obtains from its investments, without deducting any management fees, fund expenses or carried interest. Net returns are the returns a limited partner (LP) receives from the fund, after deduction of all management fees, fund expenses and carried interest. LPs are about net returns, as net returns are the real returns an LP receives from its investment in a fund.
When we talk about gross vs net returns, it can apply to gross vs net IRRs or gross vs net TVPI multiple.
The graphic below shows the difference between gross and net returns for a fund. LPs invest in a fund. The fund invests in portfolio companies. Gross Returns are the returns the fund obtains from its investments in portfolio companies. Gross Returns are before deducting management fee, fund expenses and carried interest. Once the fund does deduct the management fee, fund expenses and carried interest, the return the LPs obtain from the fund are the Net Returns.
To read more, please click on "Read More" link below.
Okay, now that we understand gross vs. net return, the question is “how big a difference is there between the two?” The answer is that it depends, and it will be different for each fund. However, I use the following rule of thumb. Absent any other information, I take 1.0x off a gross TVPI multiple to estimate a net TVPI multiple, and take 10% off a gross IRR to estimate a net IRR. This rule of thumb usually overstates the difference, but it serves as a rough guide until the real net returns can be obtained.
Let’s look at at the following examplel to illustrate this.
Example:
AdVenture Capital Fund III, L.P. (“Fund 3”) is a $100 million venture capital fund. It charges a 2% per annum management fee during the five-year investment period, and then the management fee declines by 25 bps (25 basis points equals 0.25%) each year with a minimum management fee of 1% per year. Fund 3 has a 20% European carry (carry is paid only after LPs have received distributions equal to their paid-in-capital). Fund 3 has $750,000 in fund formation expenses and $250,000 in annual fund expenses (insurance, audit, back office, legal, travel, etc.). We also assume a 10-year fund and no recycling.
Gross Returns:
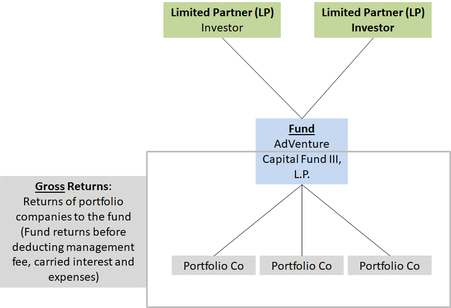
First, we’ll calculate the gross returns. Looking at the diagram, we see that the gross returns involve the fund and its portfolio company investments.
Let’s look at at the following examplel to illustrate this.
Example:
AdVenture Capital Fund III, L.P. (“Fund 3”) is a $100 million venture capital fund. It charges a 2% per annum management fee during the five-year investment period, and then the management fee declines by 25 bps (25 basis points equals 0.25%) each year with a minimum management fee of 1% per year. Fund 3 has a 20% European carry (carry is paid only after LPs have received distributions equal to their paid-in-capital). Fund 3 has $750,000 in fund formation expenses and $250,000 in annual fund expenses (insurance, audit, back office, legal, travel, etc.). We also assume a 10-year fund and no recycling.
Gross Returns:
First, we’ll calculate the gross returns. Looking at the diagram, we see that the gross returns involve the fund and its portfolio company investments.
Gross returns are the returns at the fund level, before deducting management fee, carried interest and fund expenses. Gross return can be calculated investment by investment or for a portfolio of investments. Let’s look first at the fund’s investments:
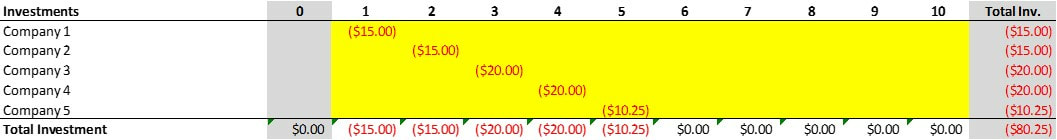
Assume Fund 3 makes one investment per year, for a total of five investments (this is a simplified example, as most funds invest in more than five companies), as shown in the table below. Note that investments are negative numbers here as they are cash outflows from the fund. The "0" column represents the fund's initial capital call, when the IRR clock starts to run. The "1" column is year 1, "2" is year 2, etc.
Assume Fund 3 makes one investment per year, for a total of five investments (this is a simplified example, as most funds invest in more than five companies), as shown in the table below. Note that investments are negative numbers here as they are cash outflows from the fund. The "0" column represents the fund's initial capital call, when the IRR clock starts to run. The "1" column is year 1, "2" is year 2, etc.
Now assume that the fund achieves the following amounts when it exits its investments. These numbers are positive numbers reflecting exit proceeds realized by the fund.
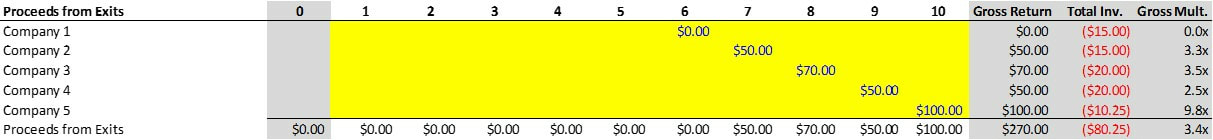
As the above table indicates, the first investment of $15 million in year 1 was a write-off (gross multiple of zero), the second investment of $15 million in year 2 returned $50 million in year 7 (for a gross multiple on investment of 3.3x), the third investment of $20 million in year 3 returned $70 million in year 8 (for a gross investment of 3.5x), and so on. Overall, Fund 3’s investments returned a total of $270 million on total investment of $79.5 million, for a gross return of 3.4x. This is gross return – the return the fund has on its investments.
When the cash flows of the fund’s investments and the exit values are combined, the gross IRR can be calculated.

As the table above indicates, the fund invested in five companies over five years (negative numbers to indicate cash outflows). In years five through 10, the fund received proceeds from exiting the companies (positive numbers to indicated cash inflows). The exits could have been through the companies being sold or going public - in either event, the fund sells its position in the portfolio company and receives cash in this example. The result is that Fund 3 has a 3.4x gross investment multiple and a 23.1% gross IRR. This sounds like a good result, but that's where people get fooled. This is a gross result and not the net result. For the net result, read on.
Net Returns:
Now let’s look at the net returns to the LP. Net returns to the LP are based on the LPs cash flows. The LP makes contributions to the fund and receives distributions from the fund. Net returns to the LP are at the LP level, after management fee, carried interest and fund expenses have been deducted. Looking at the diagram below, we are looking at the green shaded boxes.
In order to calculate the net returns, calculations for management fee, carried interest and fund expenses must be made.
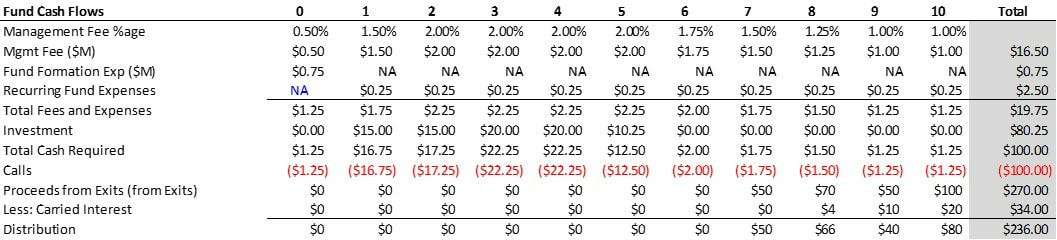
This is an ugly table, but let's go through it. Recall column "0" is the time of the fund's first capital call - the time when the IRR clock starts ticking. At time = 0, the fund will call enough capital to pay for the fund formation expenses (here $750,000), the initial management fee (which is paid quarterly in advance), other expenses and to make any investments that are ready to be made. As the table above shows, total calls over the life of the fund are $100 million (negative numbers indicating a cash outflow for the LPs), and total distributions to the LPs are $236 million, for a net TVPI of 2.36x, rounded to 2.4x net TVPI.
When the cash flows (calls made by the LPs and distributions received by the LPs) are modeled, the net IRR can be calculated.
When the cash flows (calls made by the LPs and distributions received by the LPs) are modeled, the net IRR can be calculated.
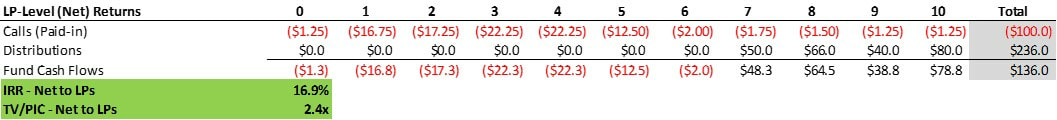
The above table shows the calls paid by the LP, the distributions received by the LP, and the net cash flows. With these cash flows, the LPs have a net IRR of 16.9% and a net TVPI multiple of 2.4x.
The gross and net results are summarized in the table below
The gross and net results are summarized in the table below
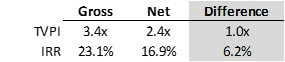
In this example, the differential between gross and net TVPI is 1.0x and the difference between gross and net IRR is 6.2%. My rule of thumb (deduct 1.0x from gross TVPI to get net TVPI and 10% from gross IRR to get net IRR, is pretty close here.
Now let's look at another example.
Example 2:
Let’s use the same assumptions as in example 1 above, including the total proceeds from exits, except the exit values will change.
Now let's look at another example.
Example 2:
Let’s use the same assumptions as in example 1 above, including the total proceeds from exits, except the exit values will change.
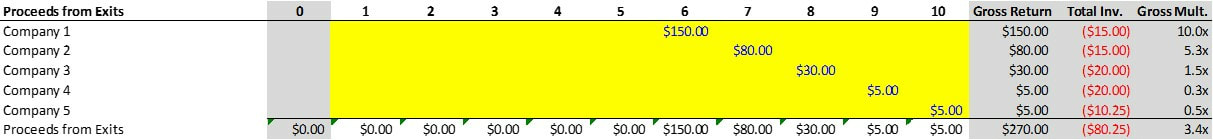
In the above table, the total exit proceeds the fund receives is the same ($270 million) as the last example, so gross multiple is the same (3.4x) as the gross multiple in the example above. The difference is the timing of the exits. The fund exits Company 1 in year 6 for $150 million, realizing a 10x gross return on this investment. The fund exits Company 2 in year 7 for $80 million, realizing a 5.3x gross return on this investment. And so on. The difference between these examples is that the exit values are more front-loaded – in the above example, the fund receives $230 million in exit proceeds in years 6 and 7, compared to $50 million in years 6 and 7 in the prior example.
The result? Gross TVPI of 3.4x and net TVPI of 2.4x. Gross IRR of 36.9% and net IRR of 27.1%. The results are in the table below.
The result? Gross TVPI of 3.4x and net TVPI of 2.4x. Gross IRR of 36.9% and net IRR of 27.1%. The results are in the table below.
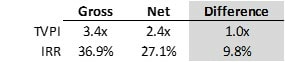
Because the total investment amount and total exit proceeds remain the same in both cases at $80.25 million invested and $270 million received by the fund in exit proceeds, the gross and net TVPI does not change between examples. However, the gross and net IRR do change as the fund receives exit proceeds earlier, which increases the IRR. Note however, that the spread between gross and net IRR is now 9.8%.
Recall my rule of thumb: Deduct 1.0x from Gross TVPI to obtain Net TVPI, and deduct 10% from gross IRR to obtain net IRR. In this example, the rule of thumb is spot on, but most of the time the rule of thumb overstates the differential.
Rule of Thumb Data. I have a small data set of funds that have provided gross and net returns. In my data set, the the range of differential for gross to net TVPI is from 0.1x to 1.4x and the range of differential for gross to net IRR is 3.9% to 12.6%. This data suggests that the rule of thumb should be to deduct .6x from gross TVPI to obtain net TVPI and to deduct 8% from gross IRR to get net IRR. However, because the ranges are so wide, I will still go with my rule of thumb until I get better information from the fund.
In his article "A Note on Direct Investing in Private Equity" in the Alternative Investment Analyst Review (1Q 2016), Prof. Ludovic Phalippou of the Said Business School at the University of Oxford discusses buyout fund fees and indicates that the average gross returns are 18% and net returns are 11%, for a differential of 7%. This 7% is more in line with the findings from my small fund data set. Prof. Phalippou's insightful note can be found at https://caia.org/aiar/access/article-919.
Take-aways:
Request to the reader: Please help me improve this post. Please contact me with any suggestions on how to make this better, clarifications and typos. Thanks!
Also, thanks to Mark for finding an error in the spreadsheet in a prior version of this post. The error has been fixed.
© 2018 Allen J. Latta. All rights reserved.
Recall my rule of thumb: Deduct 1.0x from Gross TVPI to obtain Net TVPI, and deduct 10% from gross IRR to obtain net IRR. In this example, the rule of thumb is spot on, but most of the time the rule of thumb overstates the differential.
Rule of Thumb Data. I have a small data set of funds that have provided gross and net returns. In my data set, the the range of differential for gross to net TVPI is from 0.1x to 1.4x and the range of differential for gross to net IRR is 3.9% to 12.6%. This data suggests that the rule of thumb should be to deduct .6x from gross TVPI to obtain net TVPI and to deduct 8% from gross IRR to get net IRR. However, because the ranges are so wide, I will still go with my rule of thumb until I get better information from the fund.
In his article "A Note on Direct Investing in Private Equity" in the Alternative Investment Analyst Review (1Q 2016), Prof. Ludovic Phalippou of the Said Business School at the University of Oxford discusses buyout fund fees and indicates that the average gross returns are 18% and net returns are 11%, for a differential of 7%. This 7% is more in line with the findings from my small fund data set. Prof. Phalippou's insightful note can be found at https://caia.org/aiar/access/article-919.
Take-aways:
- Gross returns are always higher than net Returns. The only time they can be equal to each other is if the fund has no management fee, no carry and no expenses!
- My rule of thumb is to deduct 1.0x from gross TVPI to obtain net TVPI, and deduct 10% from gross IRR to obtain a net IRR. This rule of thumb typically overstates the differential between gross and net returns, but until better information is obtained from the GP, it can provide an initial basis for comparison.
Request to the reader: Please help me improve this post. Please contact me with any suggestions on how to make this better, clarifications and typos. Thanks!
Also, thanks to Mark for finding an error in the spreadsheet in a prior version of this post. The error has been fixed.
© 2018 Allen J. Latta. All rights reserved.
