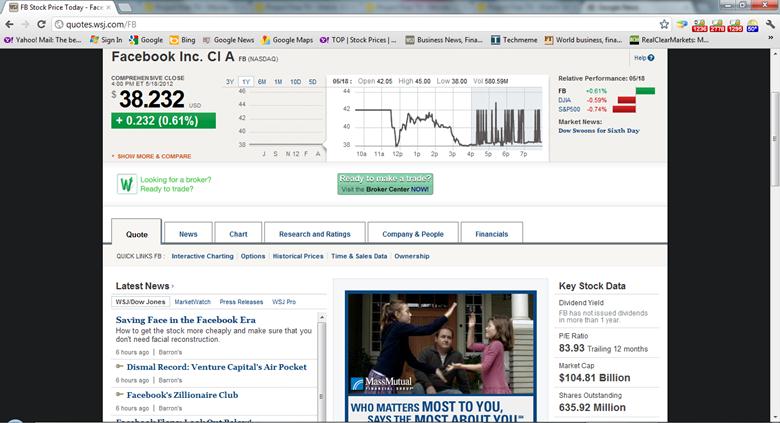
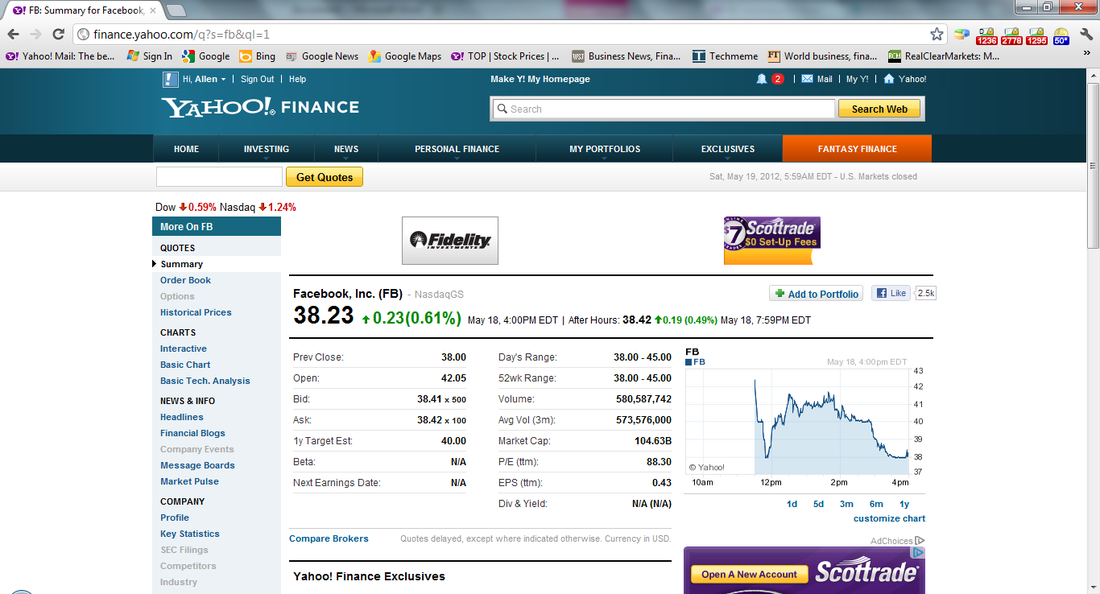
Facebook had its first day as a public stock yesterday and ended the day with a market capitalization of $104.63 billion according to the Wall Street Journal and Yahoo! Finance (see below).
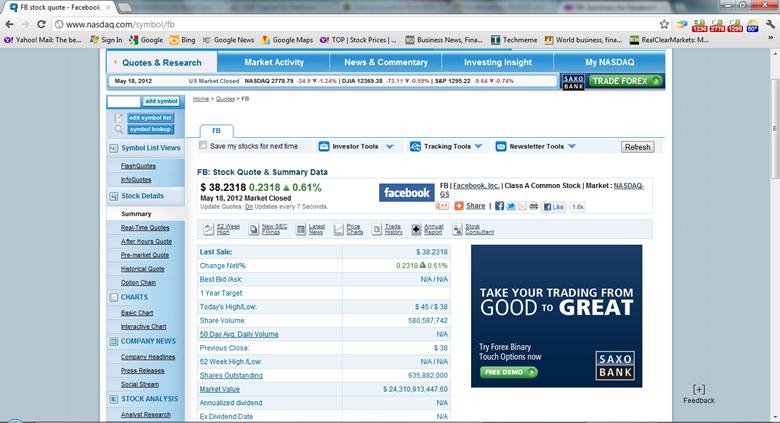
However, according to NASDAQ (where Facebook is listed), Facebook's market cap was $24.31 billion (see below).
But according to Bloomberg, Financial Times, Google Finance, and me, Facebook's market cap at the end of the day was $81.74 billion.
Why the discrepancies? First an anecdote. One of the painful learning experiences I had as a young investment banker was relying on a well-known data service for information and not checking the source documents. The lesson I learned is that data services can and do make mistakes. This is why you will see that I link to the source SEC filings in my posts. Always check the source data.
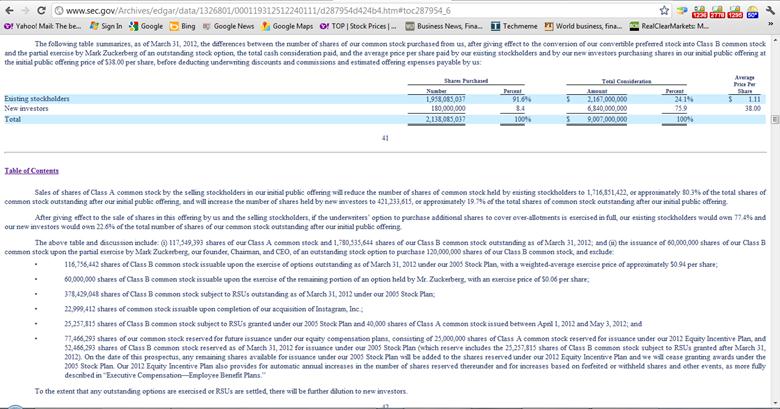
Now to answer the question. Market cap is simply the number of shares outstanding multiplied by the stock price. According to Facebook's final prospectus filed with the SEC (see below), there were 2,138,085,037 shares outstanding as of March 31, 2012. But from then until May 3, the company issued an additional 40,000 shares of Class A stock (read the fifth bullet point below the table carefully). This means there are 2,138,125,037 shares outstanding as of the IPO (assuming no stock was issued after May 3, which they'd have to disclose). With a closing price of $38.23, this gives a market cap of $81.74 billion. A screen shot of Facebook's final prospectus with these details is below.
Why the discrepancies? First an anecdote. One of the painful learning experiences I had as a young investment banker was relying on a well-known data service for information and not checking the source documents. The lesson I learned is that data services can and do make mistakes. This is why you will see that I link to the source SEC filings in my posts. Always check the source data.
Now to answer the question. Market cap is simply the number of shares outstanding multiplied by the stock price. According to Facebook's final prospectus filed with the SEC (see below), there were 2,138,085,037 shares outstanding as of March 31, 2012. But from then until May 3, the company issued an additional 40,000 shares of Class A stock (read the fifth bullet point below the table carefully). This means there are 2,138,125,037 shares outstanding as of the IPO (assuming no stock was issued after May 3, which they'd have to disclose). With a closing price of $38.23, this gives a market cap of $81.74 billion. A screen shot of Facebook's final prospectus with these details is below.
So how did the Wall Street Journal and Yahoo! Finance get it wrong? They used the number of fully-diluted equity shares outstanding rather than regular outstanding shares. Fully-diluted equity shares outstanding assumes the exercise of all options and warrants, and gives a much bigger number (for an explanation of the difference between these, please see my earlier post on the difference between market cap and fully-diluted equity).
How did NASDAQ get a market cap of $24.31 billion? Beats me.
Update: As of 2:30 pm Pacific Time, Yahoo! Finance now has Facebook's market cap at $51.6 billion. Still wrong....
Link to Facebook's final prospectus: http://www.sec.gov/Archives/edgar/data/1326801/000119312512240111/d287954d424b4.htm
Link to my earlier post on market cap v. fully-diluted equity:
http://www.allenlatta.com/1/post/2012/5/market-capitalization-v-fully-diluted-equity-valuation-the-facebook-example.html
